Before the arrival of John Batman and his party on the shores of Port Phillip Bay in 1835, the indigenous tribes of the Barwon catchment walked the land, following traditional "songlines" which had evolved over thousands of years. The songs and stories of the many tribes, described the land and the physical pathways they used to cross the countryside, enabling them to navigate long distances, passing safely through unfamiliar territory. I discussed songlines in my previous
post.
Europeans on the other hand, saw the land very differently to the indigenous population and used very different navigation techniques. The Europeans too used maps, however they drew their maps on paper, measured distance, calculated elevations and aligned everything according to compass bearings. And they way they travelled was vastly different too. Whilst many still walked, others rode horses and drove bullock drays and it wasn't long before the paths of the songlines became the bullock tracks of the squatters. They in turn were followed by the surveyors with their chains and newfangled theodolites who marked out the roads of the selectors and villagers.
The settlers were also quick to start applying their own mapping techniques to their new surroundings. The squatter's runs were plotted out and the bullock tracks which linked them with the towns which began to pop up, were marked as vague wavy lines.
 |
Section of Surveyor Alexander Skene's 1845 map of the Geelong District
showing early tracks and the names of squatters and early landholders
across the catchment. Original image held by the State Library of Victoria |
The more the number of settlers increased however, and the more they extended the boundaries of their settled districts, the more maps were created. Not only did these maps indicate direction and location, but there were also administrative maps, electoral maps, geological maps, maps which indicated individual land ownership (an unfamiliar concept to the indigenous peoples), weather maps and many other types of maps besides. Soon the entire colony had been layered with maps and amongst the earliest of these maps were survey maps.
In order to better administer the vast areas of the new colony, the land was formally divided for the purpose of administering the sale and distribution of land. From the late 1840s until the 1890s, the government progressively undertook a comprehensive survey of the Colony of Victoria, reclaiming the squatters' leaseholds and breaking up the thousands of acres into village allotments and farm-sized blocks. To aid administration, county boundaries were established and within each county the land was subdivided into civil parishes.
 |
Portion of the Victorian Counties Atlas, 1874, showing those counties which fall
within the Barwon Catchment. Image taken from the State Library of Victoria |
Initially, the county boundaries were by necessity ill-defined and changed according to need. The following description from the
Geelong Advertiser 17th July, 1841, claiming to give the first official description of Grant County's limits, shows both how they changed over time and - like the Wathaurong whose lands it covered - how the new settlers also used the natural landscape to define boundaries.
The Coast Line from the mouth of the Werriby(sic), Port Phillip, round to a point bearing south of the sources of the Barwon [Barwon Heads]. An imaginary line from that point to the sources of the Barwon [the Otways]. the Barwon from its sources to its junction with the Native Hut Creek. The Native Hut Creek from that junction to the Buninyong and Melbourne road(sic). The line of that road to the Werriby, and The Werriby River to its mouth.
By 1871, the 37 Victorian counties as we know them today were in place. Counties and their accompanying civil parishes were - and still are - used entirely for real estate purposes, enabling the physical description of a piece of land.
 |
Section of 1881 Victorian civil parishes map. Original image held by the
State Library of Victoria |
With European settlement came the English system of government. Having been declared a separate colony from New South Wales on 1st July, 1851, Victoria needed to put a government in place, however it was not quite the system we have today. The original Victorian parliament was unicameral - having only one house. Called the Legislative Council, it was composed of 16 electoral districts from which 30 members were chosen. Ten were nominated by the Lieutenant-Governor and 20 were elected from the eligible voting population. To be eligible to vote a person had to be a male British citizen over the age of 21 who paid mor
e than £10 per annum in rent or held the freehold for property valued at more than £100. Once again the colony was mapped and divided. This time for electoral purposes. The Wikipedia map below shows the original electoral districts and I have indicated the general area of the Barwon catchment within the black box.
 |
Electoral districts of the original Victorian Legislative Council, 1851.
Original image from Wikipedia |
Within a handful of years however, electoral boundaries were being shuffled and in 1856 a second or lower house - the Legislative Assembly - was introduced, resulting in the system we have today.
State electoral districts for both the upper and lower houses of the Victorian parliament have continued to change in response to the growing population. Today there are 88 electoral districts, each corresponding to a seat in the Legislative Assembly. These are combined into eight districts from which five Legislative Council members are elected, giving a total of 40 members in the upper house.
 |
Current boundaries of the state electoral districts (lower house) which
cover the Barwon catchment. Original image from Wikipedia |
In 1901, the cartographic landscape of the Barwon catchment changed once again with the advent of Federation. The Colony of Victoria became the State of Victoria and was divided for the purpose of voting into federal electoral divisions. These were (and still are) different to the electoral districts of the state government. The electorates of Corangamite, Ballarat and Corio are all, at least in part, within the catchment.
 |
| Federal seats within the Barwon catchment. Original image from Wikipedia |
Of course, beneath the federal and state levels of government is local government. In the 19th century, local government stemmed from the need to raise funds for roads and infrastructure, consequently a series of "road districts" were gazetted across the colony. Within a few years, the road districts were transformed into shires which along with cities and boroughs today make up the various municipal districts of the local government system. Not surprisingly, as with state and federal electorates as well as county and parish boundaries, the banks of the creeks and rivers of the Barwon catchment often formed the boundaries of these early shires too. Also in keeping with other levels of government, the number of municipal districts has changed over the years. For instance, in 1915, the Shire of Meredith was amalgamated with that of Bannockburn.
 |
Country Roads Board map, 1961 showing parish boundaries. Original image held by the
State Library of Victoria |
In 1994, sweeping changes saw the amalgamation of many smaller shires and city councils in to a lesser number of much larger shires and cities. Where before the catchment contained perhaps as many as many as 15 shires and cities, after the amalgamations, this number fell to around six.
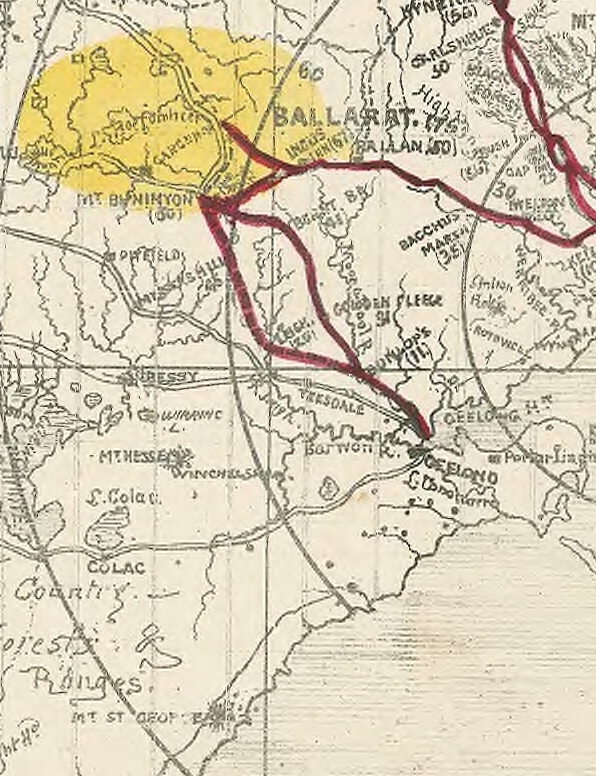
The outbreak of the Victorian gold rush in August, 1851 also saw a flurry of map making. Every digger wanted to know the best route to get to the diggings. As I have written before, there were claims, counter claims, insults and outright lies hurled back and forth between parties with vested interests in promoting
their route to the diggings. Maps could not only be used to inform the general public (as below), but also to deceive as Geelong discovered when interests in Melbourne published a
"false map".
 |
The relevant section of a reasonably accurate "Digger's road guide to the gold mines of
Victoria and the country extending 210 miles around Melbourne", 1853. Image taken from
the National Library of Australia |
As well as the topography of the land and the roads and tracks which crossed it, the gold rush led to an intense interest in what lay under the surface of the soil. In 1852 Alfred Selwyn was appointed as Mineral Surveyor for the Geological Survey of Victoria and with one assistant and a tent-keeper, set about completing a comprehensive geological survey of the colony. Soil types were assessed, rock deposits dated and the potential presence of minerals noted. Over the years, the department expanded and exists today under the portfolio of the Department of Energy and Earth Resources in the Department of Economic Development, Jobs, Transport and Resources.
 |
Adaption of the 1909 Geological Survey Map of Victoria. Image held by the
State Library of Victoria |
Finally, another topic which has always been of particular interest to those living in the Barwon catchment. Rainfall. How much? How little? When? Where? Once again, the indigenous tribes had intimate knowledge of seasonal changes in climate and climate-dependent resources. The European settlers were equally as interested. They needed to know when to plant their crops and where to find water for their stock in different seasons.
Meteorological recording began in Melbourne as early as 1840 and regular, coordinated data collection began in 1854 with the establishment of the Victorian Meteorological Office. The first official report of rainfall data (I could locate) for Geelong appeared in the Victorian Government Gazette dated 21st August, 1857 for the April-June quarter of that year, although references were made elsewhere to earlier data.
Today, rainfall measurements are taken at various points across the Barwon catchment, including Weeaproinah in the Otways, near the headwaters of the Barwon River which has the highest average rainfall in the state. By contrast, the lowlands along the lower reaches of the Barwon, Leigh and Moorabool Rivers lie in the rain shadow cast by the Otway Ranges and receive a significantly lower annual rainfall.
 |
Overview of long term rainfall averages for the Barwon catchment. Graph taken
from the Australian Bureau of Meteorology |
Over the years since European settlement, many maps have been produced for many different reasons, dividing the catchment in a multitude of ways. Maps to direct. Maps to divide. Maps to quantify. Maps to persuade, even maps to deceive...